
Debug an app with built-in logs and metrics
Most self-hosted platforms tell you to install Grafana and a log stack before you can answer "what happened?". Levelrail stores metrics and logs on each node as part of the platform, so the answer is a command away. In this tutorial you will search an app's logs, follow them live, read CPU and memory over time, and use the health score and attention list to find what needs work first.
Before you start
- A running Levelrail instance and the CLI logged in to it (installing).
- An app that has been running for a few minutes. Any app from the earlier tutorials works.
1. Start with what needs attention
levelrail-cli attentionSEVERITY KIND SUBJECT DETAIL
warning disk data dir 7.0% free (70057070592 of 994662584320 bytes)
warning doctor Control plane disaster recovery off-box encrypted backups are not enabledThis is one list of everything across the instance that needs action, such as low disk space or disabled backups. It is also the Needs attention card on the dashboard home.
For one app, ask for its health score:
levelrail-cli apps health-score hellohello: fail
Deploy health fail most recent deploy attempt failed
Security warn no issued certificate found yet for hello.example.com
Resilience pass health checks configured; no persistent volumes to back up
Observability fail no alert rules configured for this appEach line names a concrete gap, so you know where to look.
2. Search the logs
Logs are stored on the node and searchable by text and time window:
levelrail-cli apps logs hello --since 30m --q healthz --tail 32026-10-05T02:32:33Z stdout 172.18.0.1 - - [05/Oct/2026:02:32:33 +0000] "GET /healthz HTTP/1.1" 404 153 ...
2026-10-05T02:32:33Z stderr 2026/10/05 02:32:33 [error] 29#29: *2 open() "/usr/share/nginx/html/healthz" failed ...The flags you will use most:
| Flag | What it does |
|---|---|
--since 30m | How far back to search. Default is one hour. |
--from, --to | An exact RFC 3339 window, for a known incident time. |
--q healthz | Full-text match on the log line. |
--tail 50 | Only the last N entries. |
--json | Machine-readable output for scripts. |
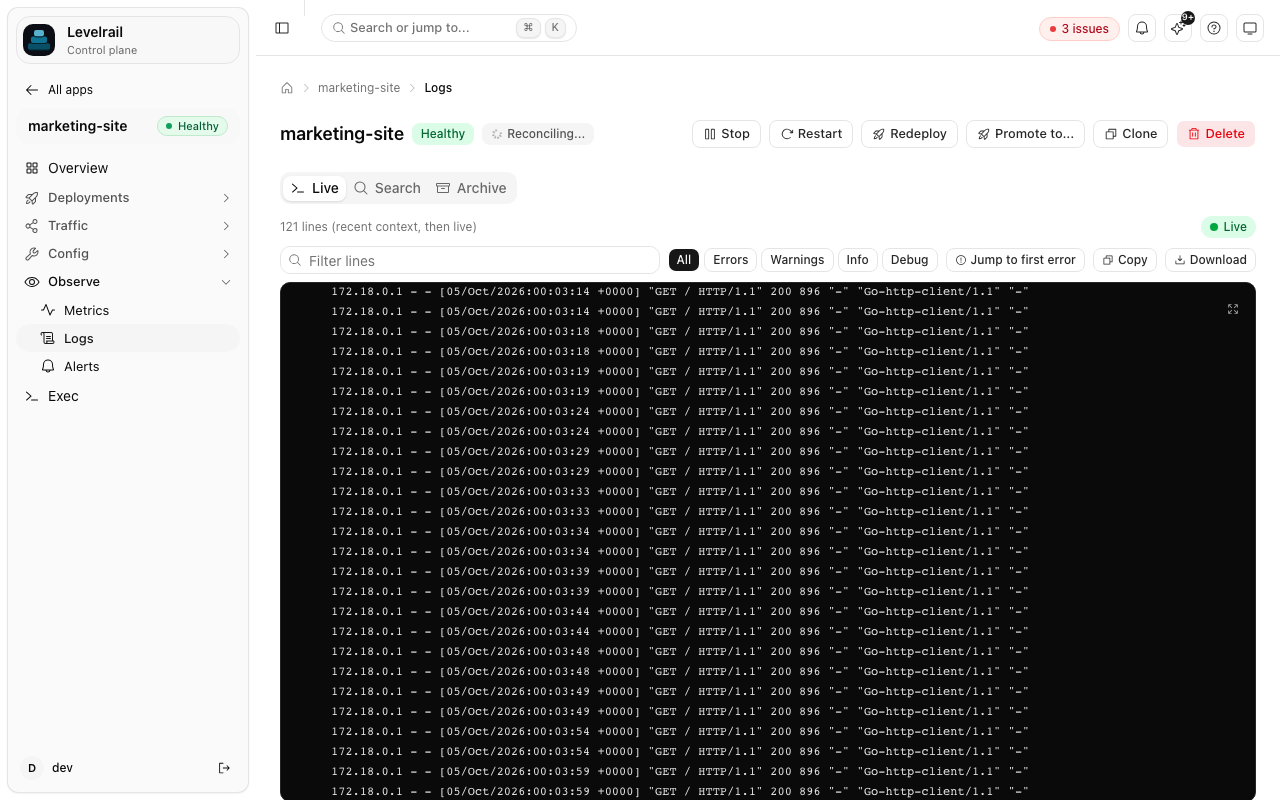
The dashboard's log viewer reads the same store, with search and live tail.
3. Follow live
levelrail-cli apps logs hello --followThis streams new lines until you press Ctrl+C. It uses the same stream as the dashboard viewer. --follow cannot be combined with --since, --q, or --tail, because it only shows new lines.
4. Read CPU and memory
levelrail-cli apps metrics hello --metric memory_usage_bytes --since 15m --step 60s
levelrail-cli apps metrics hello --metric cpu_percent --since 15m --step 60smetric: cpu_percent
TIMESTAMP VALUE COUNT
2026-10-05T02:31:50Z 0.014243333397954533 3Metrics are sampled every 15 seconds and aggregated into the bucket size you set with --step. Leave --step off to get the raw samples.
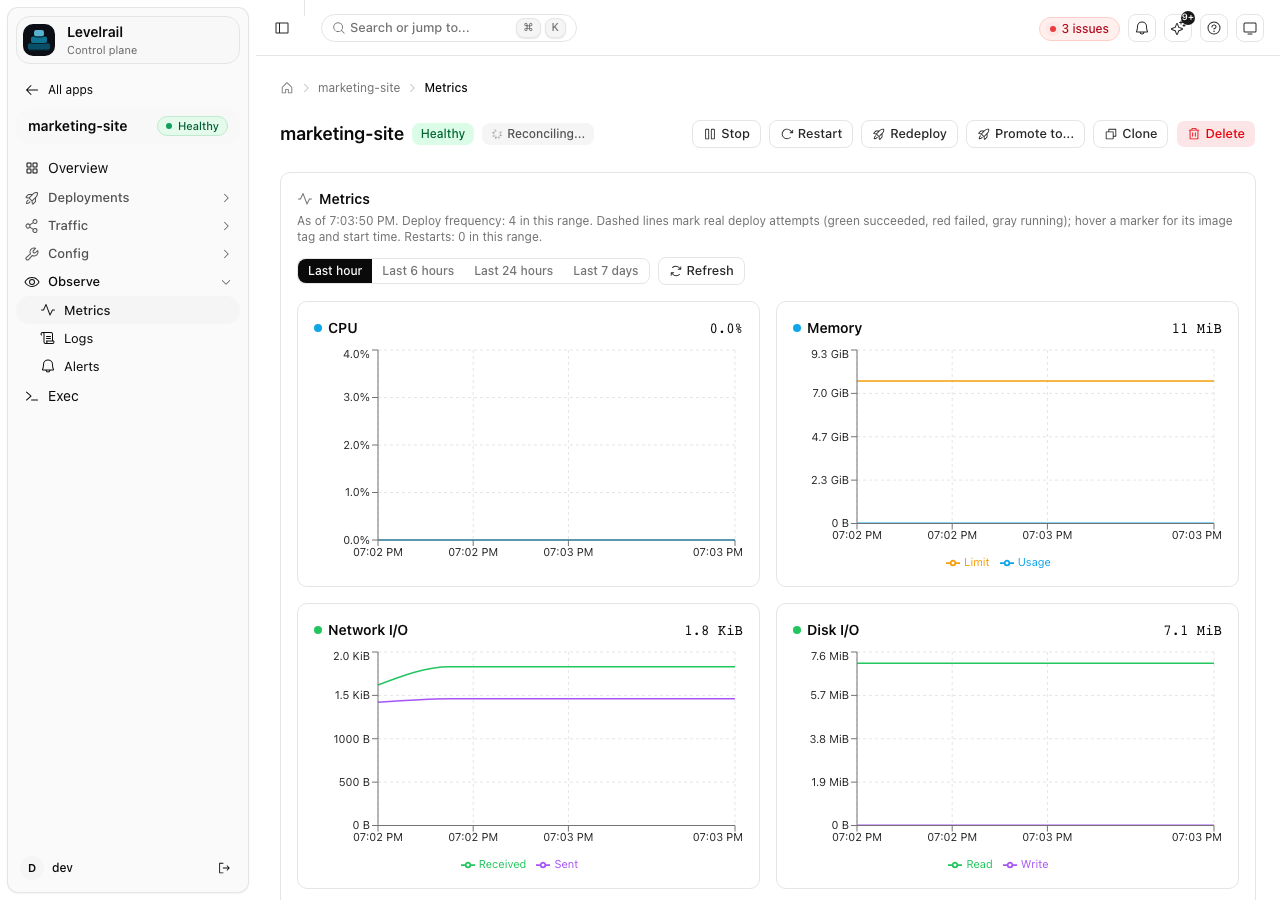
On the dashboard the same data becomes charts with deploy markers drawn on them. That is the quickest way to answer "which deploy made it slow": the line changes where the marker is.
5. Tie it back to deploys
levelrail-cli deployments summarywindow: 24h
building 0
ready 3
failed 1
rolled_back 2A spike in the metrics that lines up with a deploy usually means that release. Roll back, then investigate:
levelrail-cli apps deploys list hello
levelrail-cli apps deploys rollback-to hello <deploy-id>
Add an alert so you hear about it first
The health score above flagged Observability: fail because no alert rules exist. Alerts can go to Slack, Discord, email, Telegram, PagerDuty, ntfy, and other channels. Start with Observability and Email notifications.
Where to go next
- Observability: how the node-local stores work and how retention is set.
- Log archive: keep logs in object storage beyond the local window.
- Zero-downtime deploys with health checks: catch the problem before it ships.